| |
Frequency Plot |
|
|
Next Page |
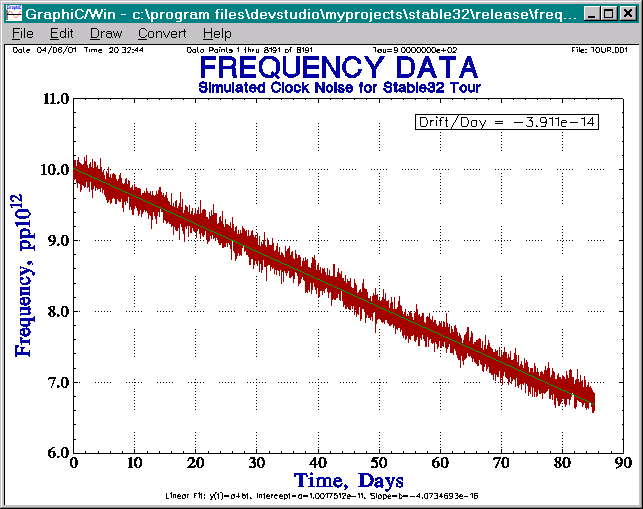
| Use the Plot function to draw a plot of the frequency data with a linear regression line showing the frequency drift. Many options are available for scaling and annotating phase and frequency data plots. The Stable32 plotting functions use GraphiC, a publication-quality scientific graphic library. They support the display, printing, format conversion, storage and replay of all Stable32 data, stability, power spectrum and histogram plots. | ||

|
||
| Frequency Data Plot |
|
Page 10 of 15 |